There are a couple of plans I have to improve the performance of this blog. Among other things, I want to try enabling opcache preloading.
But, if you want to find out how well this works, you have to measure the performance before and after.
Over the past couple of weeks, I’ve thought about many different approaches. Turns out it is very hard to come up with 1 way to “measure performance”.
In the end, I made the decision that it is more important to be consistent than to optimize the performance test itself.
So, I’ve come up with a script that measures the performance of a webpage. You can run it easily and it stores all necessary data. It also contains some nice ways to compare performance across measurements.
Measuring performance with Apache Benchmark
So, my way of measuring performance is now stored in the ab-runner repository.
A simple test can be executed by running ./abrunner.js measure -u https://localhost.test/ -o results/foo.
By default, the measure command does the following:
- Using Apache Benchmark, it makes 500 requests with a concurrency of 10.
- It repeats that test 10 times, with 5 minutes of waiting time between each test.
- It combines the results and plots the data so you can visually inspect it.
As mentioned before, I believe that a consistent approach is the most important thing here. As long as all measurements are taken in a similar way, they give comparable results.
Still, the default values have some reasoning behind them.
The number of requests and concurrency should not be too high. My goal is not to overload the server. Instead, I’m curious what the “normal performance” of the website is.
Performance tests can be influenced by outside factors. Maybe my server is busy running a cronjob. Maybe my internet connection is temporarily slow. To account for these outliers, the script takes multiple measurements that are spaced out over time.
If you go over to the ab runner repository, you can see how to run the script yourself and change the default values.
Comparing performance
Of course, this whole thing is set up so you can easily test your website before and after a change and see the difference.
Comparing multiple measurements is as easy as running ./abrunner.js compare with a set in input files, labels, and an output directory. You can compare 2 or more measurements.
The compare command results in a plot like this:
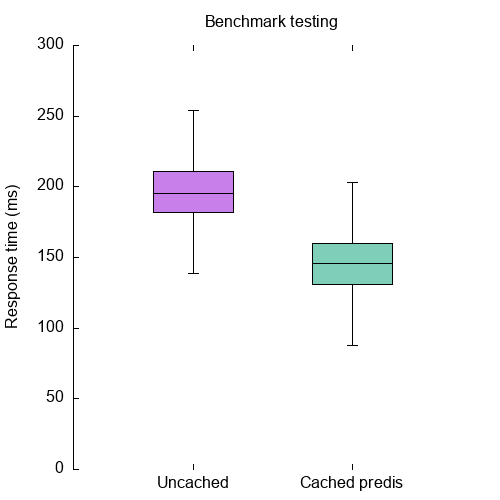
Besides that, it also creates a file with some information about the mean, median, min, and max values for all input files.
If you are unsure how to interpret this value, I recommend you read this excellent mathbootcamps.com article on how to read a boxplot.
Conclusion
Using these scripts it should be quick and easy to measure and compare the performance of different configurations. If you are interested, please head over to the ab-runner repository and try it out for yourself.
If you do give it a try, I would love to hear your feedback!